JULY | AUGUST 2017
Almond Facts
31
those messages are finally being heard and we remain
cautiously optimistic that they are having an effect. As an
example, last year’s (2015-16) survey was the first winter in
which backyard beekeepers reported
Varroa
as a top cause
of loss. Additionally, having multiple organic controls that
are applicable during different seasons of the year allow
many more options for all beekeepers. This, coupled with
a generally milder spring and fall, also may have permitted
additional opportunities to treat and more effective
treatments using the correct, label usage temperatures.
You can read the full report at our website,
.
beeinformed.org/, but we want to take this opportunity
to explain the survey and the results. Before BIP started
recording losses, there were no other numbers to compare
what “normal” losses are for beekeepers and what is
excessive. We are also trying to make the results more
accessible every year by improving our website.
The Bee Informed Partnership reports total loss, or a
weighted loss rate. Total loss treats each colony the same or
more simply stated, “
One colony one vote.
” This means
that the total loss rate is more representative of commercial
beekeeper loss as they manage a large majority of the
colonies in the survey. The average loss rate, which we no
longer report in our preliminary summary, is an unweighted
rate where we calculate the loss rate for each responding
beekeeper and average these rates. So average loss, more
simply stated is, “
One beekeeper, one vote.
” As there
are many more backyard beekeepers than commercial
beekeepers, average loss rates are more influenced by these
smaller beekeepers.
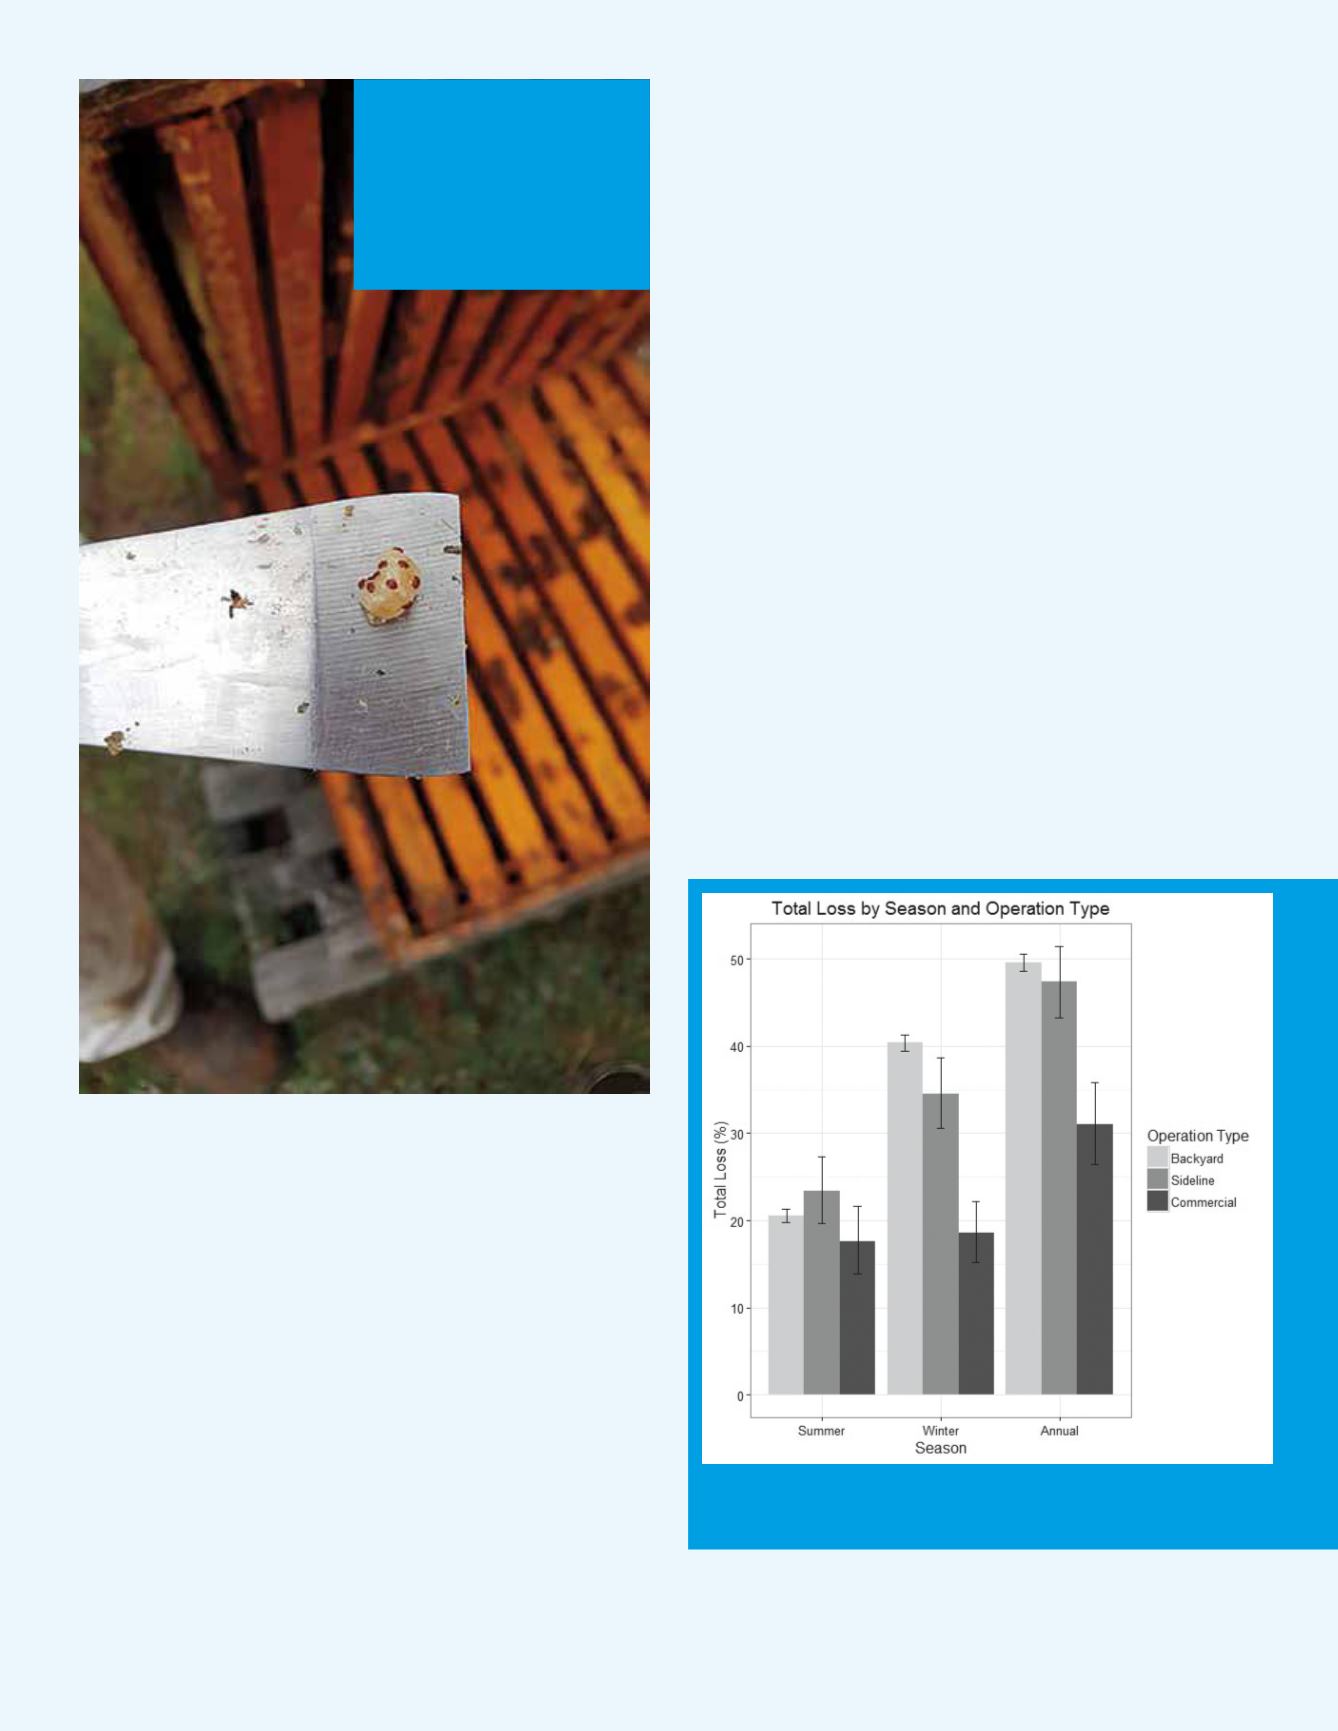
Because the BIP winter loss results are presented as one
number (21.1% total winter loss), it does not show the huge
variability in what commercial beekeepers (and other
operational sizes) report as their losses. Consistently across
all BIP survey years, commercial beekeepers reported
having fewer winter and annual losses compared to backyard
beekeepers. For this year, Figure 3 illustrates the variation of
losses across operation types from the BIP survey and lower
losses continue to hold true for commercial operations.
Photo shows many Varroa mites
on a young honey bee pupa. Varroa
mites are arguably the largest
driver of colony loss in the US.
Messaging and methods to manage
Varroa mite populations have been
increasing over the past few years.
Photo courtesy of the Bee Informed
Partnership, Inc.
Figure 3: Preliminary Total Losses by Operational Size (Backyard<50 colonies,
Sideline<500 colonies and Commercial>500 colonies)


